Pipeline Bubble Analysis
Quantifying efficiency loss from pipeline bubbles and strategies to minimize them — with formulas and practical targets.
The pipeline bubble is the fraction of time GPUs sit idle due to pipeline warm-up and drain. This chapter quantifies it precisely and shows how to minimize it.
1. Bubble Fraction Formula
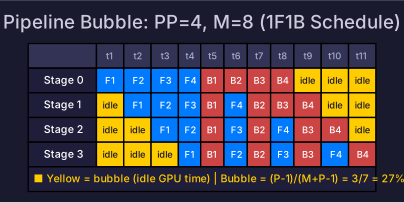
For pipeline stages, micro-batches, and equal compute time per micro-batch per stage:
| PP stages | M=4 | M=8 | M=16 | M=32 | M=64 |
|---|---|---|---|---|---|
| 2 | 25% | 12.5% | 6.3% | 3.1% | 1.6% |
| 4 | 43% | 27% | 16% | 8.6% | 4.5% |
| 8 | 54% | 47% | 30% | 18% | 9.8% |
| 16 | 79% | 65% | 48% | 32% | 19% |
Target: Bubble < 10%. For PP=4, need M≥32. For PP=8, need M≥64.
2. Impact on MFU
Pipeline bubble directly reduces Model FLOPS Utilization:
For a system achieving 50% MFU with no bubble and PP=4, M=16:
That 8% MFU loss translates directly to longer training time and higher cost.
3. Reducing Bubble
| Strategy | Bubble formula | Tradeoff |
|---|---|---|
| More micro-batches | Larger effective batch size (may hurt convergence) | |
| Fewer PP stages | Reduces | Need more TP or bigger GPUs |
| Interleaved schedule | More P2P communication | |
| Zero-bubble schedule | ~0% | Higher memory, more complexity |
Interleaved Schedule Example
PP=4 physical stages, 2 virtual stages each (, ):
vs standard 1F1B:
Wait — interleaved is worse here because . The benefit comes when you can use fewer physical stages:
With interleaved (), PP=2 physical (4 virtual): bubble = vs non-interleaved PP=4: bubble =
Interleaved lets you use fewer physical stages (each handles more virtual stages), which reduces communication while maintaining a deep pipeline for memory reasons.
4. Practical Measurement
# Measure pipeline bubble in Megatron-LM
# Look at the timers:
# - forward-compute
# - backward-compute
# - forward-recv / backward-send (P2P)
# - idle (bubble)

# Bubble = total_time - (forward_compute + backward_compute + communication)
# Bubble% = bubble_time / total_time

# Or use NVIDIA Nsight Systems:
# nsys profile -o pipeline_trace torchrun ... train.py
# Look for gaps between kernels on each GPU
For overall training efficiency metrics beyond bubble, see Cluster Efficiency Metrics.
Self-Check
- Calculate bubble fraction for PP=8, M=32
- Calculate the MFU impact of a 15% bubble
- Determine minimum micro-batches for <10% bubble given PP degree
- Compare interleaved vs standard 1F1B bubble for a given configuration
- Measure pipeline bubble from profiler traces