Cluster Efficiency Metrics
MFU, GPU utilization, bubble ratio, communication overhead — measuring and diagnosing what's limiting your training throughput.
You can’t optimize what you can’t measure. This chapter defines the key efficiency metrics for large-scale training and shows how to diagnose which bottleneck is limiting your throughput.
1. Model FLOPS Utilization (MFU)
MFU is the gold standard metric — it measures what fraction of the GPU’s peak compute you’re actually using for useful model computation:
Calculating Model FLOPs
For a Transformer with parameters, batch size , sequence length :
The factor of 6 comes from: 2× (multiply-add) × 3× (forward + backward = 3× forward).
Worked Example: 70B on 64× H100
Llama-2 70B, global batch = 1024 sequences × 4096 tokens = 4.2M tokens:
Step time (measured): 2.8 seconds.
This matches reported values for well-optimized 70B training on H100 clusters.
Note on batch size: MFU depends heavily on batch size. Larger batches amortize communication overhead and pipeline bubbles over more compute. Most large-scale training uses millions of tokens per step.
Typical MFU values:
| Configuration | MFU | Notes |
|---|---|---|
| Single GPU, no parallelism | 50-60% | Best possible (no comm overhead) |
| 8 GPUs, TP=8 | 40-50% | TP AllReduce overhead |
| 64 GPUs, TP=8, DP=8 | 35-45% | TP + DP overhead |
| 256 GPUs, TP=8, PP=4, DP=8 | 30-40% | All overheads + pipeline bubble |
| 10K GPUs | 25-35% | Failure overhead, larger bubbles |
Meta reported 38-43% MFU for Llama-3.1 405B training on 16K H100 GPUs.
2. GPU Utilization
nvidia-smi reports “GPU utilization” — but this is not MFU. It measures the fraction of time at least one kernel is running, which is nearly always ~100% during training (even idle waiting counts as “utilized” if a kernel is queued).
More useful GPU metrics:
| Metric | What it measures | How to get it |
|---|---|---|
| SM occupancy | Fraction of SMs with active warps | Nsight Compute |
| Tensor Core utilization | Fraction of time Tensor Cores are busy | Nsight Systems |
| Memory bandwidth utilization | Fraction of peak HBM bandwidth used | Nsight Compute |
| MFU | Useful compute / peak compute | Calculate from step time |
3. Diagnosing Bottlenecks
The Efficiency Waterfall
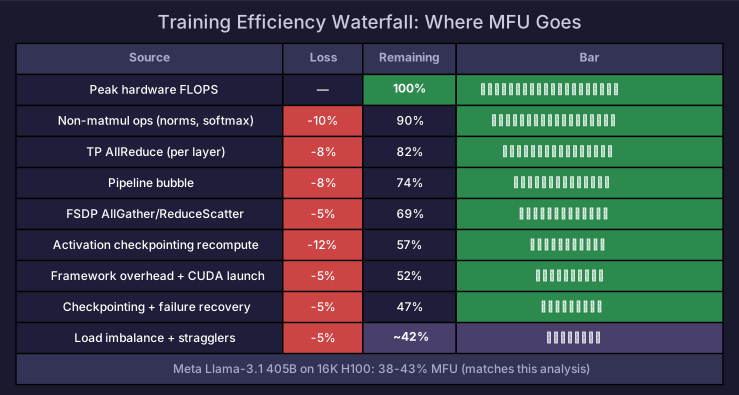
Theoretical peak (100%)
  │
  ├── -5%  Precision overhead (BF16 vs FP32 peak) → 95%
  ├── -10% TP communication → 85%
  ├── -5%  DP communication → 80%
  ├── -8%  Pipeline bubble → 72%
  ├── -5%  Memory-bound layers (LayerNorm, etc.) → 67%
  ├── -5%  Framework overhead (Python, scheduling) → 62%
  ├── -3%  CUDA graph overhead → 59%
  ├── -2%  Checkpointing → 57%
  ├── -2%  Failure recovery → 55%
  └── Actual MFU: ~55% (good single-node), ~35% (multi-node)
Identifying the Bottleneck
| Symptom | Likely bottleneck | Diagnostic tool |
|---|---|---|
| Low MFU but high GPU util | Communication overlap insufficient | Nsight Systems trace |
| Step time increases with more GPUs | Communication scaling poorly | nccl-tests bandwidth |
| Step time varies between steps | Load imbalance or garbage collection | PyTorch profiler |
| GPU temp throttling | Cooling insufficient | nvidia-smi -q -d TEMPERATURE |
| Periodic slowdowns | Checkpointing or logging | Profiler + checkpoint timing |
4. Throughput Metrics
| Metric | Formula | Target |
|---|---|---|
| Tokens/second | Maximize | |
| Tokens/GPU/second | Tokens/second / num_GPUs | Linear scaling ideal |
| Scaling efficiency | (N GPU throughput) / (N × 1 GPU throughput) | >80% |
| Time to train | Total tokens / tokens per second | Minimize |
| Cost to train | GPU-hours × price per GPU-hour | Minimize |
Goodput: The Ultimate Metric
Goodput = useful training compute / total compute time. It accounts for:
- Pipeline bubbles
- Communication overhead
- Failure recovery (lost work + restart time)
- Checkpointing overhead
For profiling tools to measure these metrics, see PyTorch Profiler and Nsight Systems.
Self-Check
- Calculate MFU for a given model, batch size, and cluster configuration
- Explain why
nvidia-smiGPU utilization is misleading for training efficiency - Walk through the efficiency waterfall for a multi-node training setup
- Identify the bottleneck from profiler symptoms
- Calculate goodput accounting for failures and checkpointing
References
- PaLM: Scaling Language Modeling (Chowdhery et al., 2022) — introduced MFU
- The Llama 3 Herd of Models (Grattafiori et al., 2024) — MFU reporting