Nsight Systems
System-wide timeline profiling — finding kernel launch overhead, CPU-GPU sync stalls, memory copy bottlenecks, and idle gaps in your training loop.
Nsight Systems gives you the big picture — a timeline showing everything happening on CPU and GPU: kernel launches, memory copies, API calls, CPU work, and idle gaps. It answers: “where is time being spent, and what’s blocking what?”
1. When to Use Nsight Systems vs Nsight Compute
| Tool | Scope | Question it answers |
|---|---|---|
| Nsight Systems | System-wide timeline | “Where is time spent? What’s the bottleneck between CPU, GPU, and memory?” |
| Nsight Compute | Single kernel deep dive | “Why is this specific kernel slow? Is it compute-bound or memory-bound?” |
| PyTorch Profiler | Framework-level | “Which PyTorch ops take the most time? What’s the operator breakdown?” |
Start with Nsight Systems to find which phase/kernel is the bottleneck. Then use Nsight Compute to optimize that specific kernel.
2. Capturing a Profile
Command Line
# Profile a training script (2 iterations, skip warmup)
nsys profile --stats=true -o training_profile \
    python train.py --max_steps=5

# Profile with GPU kernel tracing
nsys profile --trace=cuda,nvtx,osrt --gpu-metrics-device=0 \
    -o detailed_profile python train.py

# Profile specific time range
nsys profile --delay=10 --duration=30 \
    -o steady_state python train.py
From Python (NVTX markers)
import torch
import nvtx

for step in range(num_steps):
    with nvtx.annotate("forward", color="blue"):
        output = model(input)
        loss = criterion(output, target)

    with nvtx.annotate("backward", color="red"):
        loss.backward()

    with nvtx.annotate("optimizer", color="green"):
        optimizer.step()
        optimizer.zero_grad()
NVTX markers appear as colored bars on the timeline — essential for correlating GPU activity with your code.
3. Reading the Timeline
The Nsight Systems GUI shows parallel lanes:
Timeline:

CPU Thread 0:  [Python] [PyTorch dispatch] [cuBLAS setup] [idle] [PyTorch dispatch]...
CPU Thread 1:  [DataLoader worker] [preprocessing] [DataLoader worker]...

CUDA API:      [cudaLaunchKernel] [cudaMemcpy] [cudaLaunchKernel]...

GPU Kernels:   [                  GEMM                  ] [softmax] [GEMM] [LayerNorm]
GPU MemCopy:   [H2D]                                                       [D2H]

NVTX:          [============ forward ============] [==== backward ====] [opt]
What to Look For
| Pattern | Symptom | Cause | Fix |
|---|---|---|---|
| GPU idle gaps | Empty spaces between kernels | CPU is too slow dispatching | torch.compile, CUDA Graphs |
| Long H2D copies | Large memcpy blocks | Data loading bottleneck | Pin memory, async copy, prefetch |
| CPU blocked | CPU thread waiting | cudaDeviceSynchronize() too often | Remove unnecessary syncs |
| Small kernels | Many tiny kernel bars | Launch overhead dominates | Kernel fusion, CUDA Graphs |
| Uneven GPU usage | One GPU busy, others idle | Load imbalance in distributed training | Better parallelism strategy |
4. Common Bottleneck Patterns
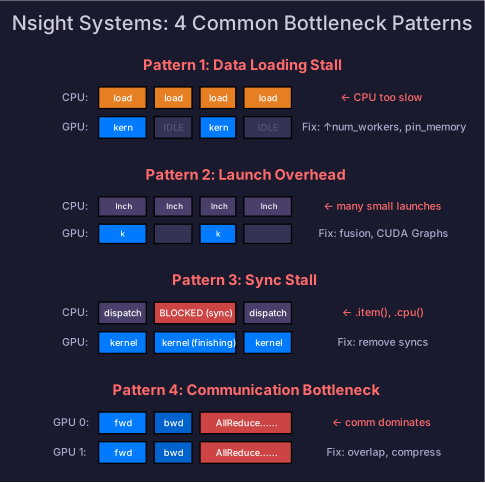
Pattern 1: Data Loading Stall
CPU:     [load batch] [load batch] [load batch]    ← CPU can't keep up
GPU: [kernel] [IDLE] [kernel] [IDLE] ← GPU starvesFix: Increase num_workers, use pin_memory=True, prefetch batches.
Pattern 2: Launch Overhead
CPU:     [launch][launch][launch][launch][launch][launch]  ← many small launches
GPU:     [k1] [k2] [k3] [k4] [k5] [k6]                   ← gaps between kernels
Each launch has ~5-10μs overhead. 100 small kernels = 0.5-1ms of pure overhead.
Fix: torch.compile (fuses ops), CUDA Graphs (one launch for many kernels).
Pattern 3: Synchronization Stall
CPU:     [dispatch] [dispatch] [BLOCKED: cudaDeviceSynchronize] [dispatch]
GPU:     [kernel]   [kernel]   [kernel finishes]                [kernel]
An explicit or implicit sync forces CPU to wait for GPU to finish.
Fix: Remove unnecessary torch.cuda.synchronize(). Use async operations. Check for hidden syncs (.item(), .cpu(), print of GPU tensors).
Pattern 4: Communication Bottleneck (Distributed)
GPU 0:   [forward] [backward] [AllReduce............] [optimizer]
GPU 1:   [forward] [backward] [AllReduce............] [optimizer]
↑ this dominatesFix: Overlap communication with computation (gradient bucketing), reduce communication volume (gradient compression, FP16 AllReduce).
5. Practical Workflow
Step 1: Capture a profile with NVTX markers
  → nsys profile -o profile python train.py

Step 2: Open in Nsight Systems GUI
  → nsys-ui profile.nsys-rep

Step 3: Identify the longest bar / biggest gap
  → Is it a kernel? → Use Nsight Compute for that kernel
  → Is it CPU? → Profile CPU code, reduce Python overhead
  → Is it a gap? → It's a sync or launch overhead issue
  → Is it communication? → Optimize distributed strategy

Step 4: Fix and re-profile
  → Compare before/after timelines
Self-Check
- Explain when to use Nsight Systems vs Nsight Compute vs PyTorch Profiler
- Capture a profile with NVTX markers in a training loop
- Read a timeline and identify GPU idle gaps
- Diagnose data loading stalls from the timeline
- Identify launch overhead and explain fixes (fusion, CUDA Graphs)
- Identify communication bottlenecks in distributed training