Full Lifecycle Cost
From pre-training investment through fine-tuning to serving — estimating the total cost of bringing a model from scratch to production.
AI infrastructure decisions are ultimately economic decisions. This chapter builds the complete cost picture — from the initial training investment through fine-tuning to the ongoing cost of serving — so you can make informed tradeoffs.
1. The Three Cost Phases
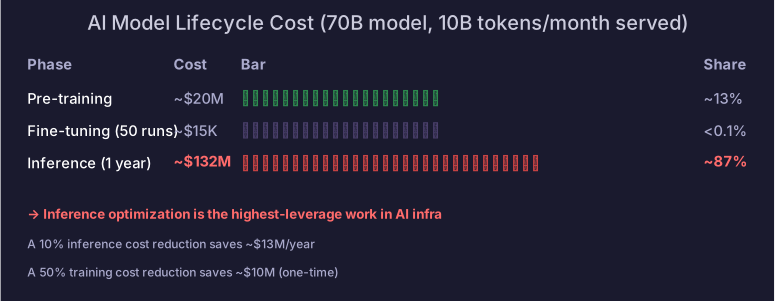
| Phase | When | Duration | Cost driver | Typical share |
|---|---|---|---|---|
| Pre-training | Once | Weeks–months | GPU-hours × price/hour | 5–20% of lifetime cost |
| Fine-tuning | Per adaptation | Hours–days | Much smaller than pre-training | <1% |
| Inference | Ongoing | Forever | Tokens served × cost/token | 80–95% of lifetime cost |
The key insight: inference dominates total cost. A model trained once serves billions of requests. Every 10% inference cost reduction saves more than a 50% training cost reduction.
2. Pre-Training Cost
Compute Cost Formula
Where (total FLOPs for parameters, tokens).
Cost Estimates by Model Size
| Model | Params | Tokens | FLOPs | H100-hours | Cost ($2/hr) |
|---|---|---|---|---|---|
| 7B | 7B | 2T | ~53K | ~$106K | |
| 13B | 13B | 2T | ~100K | ~$200K | |
| 70B | 70B | 15T | ~4M | ~$8M | |
| 405B | 405B | 15T | ~23M | ~$46M |
Assumptions: H100 at 989 TFLOPS FP16, 40% MFU, $2/GPU-hour (cloud spot pricing)
Hidden Pre-Training Costs
The GPU compute cost is only part of the picture:
| Cost component | Typical multiplier | Notes |
|---|---|---|
| GPU compute | 1.0× (baseline) | The number above |
| Failed runs / restarts | 1.2–2.0× | Hyperparameter search, loss spikes, hardware failures |
| Data preparation | 0.1–0.3× | Crawling, cleaning, deduplication, tokenization |
| Engineering team | 0.5–2.0× | 6–12 months of 5–20 engineers |
| Storage | 0.05–0.1× | Checkpoints (TB-scale), training data |
| Networking / infrastructure | 0.1–0.2× | InfiniBand, cluster management |
Rule of thumb: multiply raw GPU cost by 2.5–4× for total pre-training cost.
GPU Cloud Pricing Reference (as of mid-2026)
| Provider | GPU | On-demand ($/hr) | Spot/preemptible ($/hr) | Reserved 1yr ($/hr) |
|---|---|---|---|---|
| AWS | H100 (p5.48xlarge, 8 GPUs) | ~4/GPU) | ~1.50/GPU) | ~2.75/GPU) |
| GCP | H100 (a3-highgpu-8g) | ~3.75/GPU) | ~1.25/GPU) | ~2.50/GPU) |
| Azure | H100 (ND H100 v5) | ~3.50/GPU) | ~1.00/GPU) | ~2.40/GPU) |
| CoreWeave | H100 SXM | ~$2.50/GPU/hr | — | ~$2.00/GPU/hr |
| Lambda Labs | H100 SXM | ~$2.50/GPU/hr | — | ~$1.90/GPU/hr |
Prices change frequently. Hyperscalers bundle GPUs in fixed node sizes (typically 8 GPUs). GPU cloud providers (CoreWeave, Lambda) often offer lower per-GPU pricing but less managed infrastructure.
3. Fine-Tuning Cost
Full Fine-Tuning
Same as pre-training but on much less data:
| Config | Data | Compute | Cost (H100) |
|---|---|---|---|
| 7B, 100K examples | ~50M tokens | ~ FLOPs | ~$3 |
| 7B, 1M examples | ~500M tokens | ~ FLOPs | ~$30 |
| 70B, 100K examples | ~50M tokens | ~ FLOPs | ~$30 |
| 70B, 1M examples | ~500M tokens | ~ FLOPs | ~$300 |
LoRA Fine-Tuning
LoRA reduces trainable parameters by 100×+, but the forward/backward pass still processes the full model. Cost reduction is ~2–3× (not 100×), mainly from:
- Smaller optimizer states (only LoRA params in FP32)
- No gradient for frozen weights (but activations still computed)
- Can use smaller batch sizes due to less memory pressure
| Config | Full FT cost | LoRA cost | Savings |
|---|---|---|---|
| 7B, 1M examples | ~$30 | ~$10 | 3× |
| 70B, 1M examples | ~$300 | ~$100 | 3× |
The Real Fine-Tuning Cost: Iteration
The compute cost per run is small. The real cost is iteration — running dozens of experiments with different data mixes, hyperparameters, and evaluation criteria. Budget for 10–50 runs per model adaptation.
4. Inference Cost
Cost Per Token
Throughput depends on:
- Model size (larger = fewer tokens/second)
- Batch size (larger = better GPU utilization = more tokens/second)
- Sequence length (longer = more KV cache = fewer concurrent requests)
- Quantization (INT8/FP8 = ~2× throughput)
- Hardware (H100 vs A100 vs consumer GPUs)
Throughput Estimates
| Model | Hardware | Quantization | Throughput (tokens/s) | Cost per 1M tokens |
|---|---|---|---|---|
| 7B | 1× H100 | FP16 | ~3,000 | ~$0.19 |
| 7B | 1× H100 | INT8 | ~5,500 | ~$0.10 |
| 70B | 8× H100 (TP=8) | FP16 | ~1,500 | ~$3.00 |
| 70B | 4× H100 | FP8 | ~2,000 | ~$1.10 |
| 405B | 16× H100 | FP8 | ~800 | ~$11.00 |
Throughput varies significantly with batch size, sequence length, and serving engine optimization. These estimates assume moderate batch size (~32 concurrent requests), 2K average context, and optimized serving engine (vLLM or equivalent).
Inference at Scale: The Dominant Cost
For a popular AI service handling 10B tokens/month:
| Model | Cost/1M tokens | Monthly inference cost | Annual inference cost |
|---|---|---|---|
| 7B (FP8) | $0.10 | $1M | $12M |
| 70B (FP8) | $1.10 | $11M | $132M |
Compare to training cost:
- Training a 70B model: ~$8M (one-time)
- Serving it for 1 year: ~$132M (16× training cost)
This is why inference optimization is the highest-leverage work in AI infrastructure.
5. Cost Optimization Levers
Training Cost Reduction
| Lever | Savings | Tradeoff |
|---|---|---|
| Lower precision (FP8 training) | 1.5–2× throughput | Slightly more complex training recipe |
| Better MFU (communication overlap, tuning) | 1.2–1.5× | Engineering effort |
| Spot/preemptible instances | 2–3× cheaper | Need fault-tolerant training |
| Smaller model + more data (over-training) | Save on inference | More training tokens needed |
Inference Cost Reduction
| Lever | Savings | Tradeoff |
|---|---|---|
| Quantization (FP8/INT8/INT4) | 2–4× throughput | Small quality loss |
| Batching optimization | 2–5× throughput | Higher latency at low load |
| KV cache optimization (GQA, MLA, quantized KV) | More concurrent requests | Engineering complexity |
| Speculative decoding | 2–3× decode speed | Extra draft model compute |
| Prompt caching | Skip repeated prefill | Memory for cache |
| Smaller model (from over-training) | 2–10× | Quality depends on training |
| Model routing (small → large cascade) | 2–5× average cost | Router quality matters |
The Economic Formula
For any model serving more than ~1M requests, inference dominates. Optimize inference first.
Caveat: cost optimization is meaningless without quality constraints. The cheapest option is always “don’t run the model.” Every cost decision must be evaluated against a quality threshold — the cost-quality Pareto frontier is what matters, not cost alone.
Self-Hosting TCO: A Worked Example
Should you self-host a 70B model or use an API?
Self-hosting (8× H100 DGX):
- Hardware: ~100K/year)
- Power + cooling: ~0.10/kWh × 24/7)
- Staff (0.5 FTE ops): ~$100K/year
- Total: ~$230K/year
- Throughput: ~2,000 tokens/s (FP8, optimized) = ~5.3B tokens/month
- Cost: ~$0.043 per 1M tokens
API (GPT-4o-mini equivalent):
- 0.60/1M output
- Average: ~$0.30 per 1M tokens
Break-even: self-hosting wins at ~800M tokens/month (about $240K/year API spend). Below that, use APIs.
6. Cost Benchmarking: API Pricing as a Reference
Public API pricing reflects infrastructure costs (with margin). Prices as of mid-2026 — check provider websites for current rates:
| Provider | Model | Input (per 1M tokens) | Output (per 1M tokens) |
|---|---|---|---|
| OpenAI | GPT-4o | $2.50 | $10.00 |
| OpenAI | GPT-4o-mini | $0.15 | $0.60 |
| Anthropic | Claude Sonnet 4 | $3.00 | $15.00 |
| DeepSeek | DeepSeek-V3 | $0.27 | $1.10 |
| Gemini 2.0 Flash | $0.10 | $0.40 |
Output tokens cost 2–5× more than input tokens because:
- Input = prefill (compute-efficient, parallel)
- Output = decode (memory-BW-bound, sequential, one at a time)
Self-hosting is cheaper than API at scale — the crossover is typically around 50–100M tokens/month, depending on model size and optimization level.
Self-Check
- Explain why inference costs dominate total lifecycle cost
- Estimate pre-training cost for a 7B model on 2T tokens
- Explain hidden training costs beyond GPU compute (failure multiplier, data prep, engineering)
- Explain why LoRA saves ~3× (not 100×) on fine-tuning cost
- Calculate cost per 1M tokens given GPU price and throughput
- Name 3 inference cost optimization levers and their tradeoffs
- Explain why output tokens cost more than input tokens
References
- LLaMA 3.1 Model Card (Meta, 2024) — training compute details
- Efficiently Scaling Transformer Inference (Pope et al., 2022)
- The AI Index Report 2024 (Stanford HAI) — cost trends
- SemiAnalysis GPU Cloud Pricing — hardware cost data