Latency Metrics
TTFT, TPOT, end-to-end latency, throughput, tail latency, and goodput — defining what to measure and how to interpret results.
Inference performance isn’t a single number. Different metrics matter for different stakeholders — user experience, cost efficiency, and SLA compliance each require different measurements. Confusing them leads to optimizing the wrong thing.
1. Latency Metrics (User Perspective)
TTFT (Time To First Token)
Time from request submission to receiving the first output token:
Determined by: Queue wait time + prefill compute time (proportional to prompt length).
Matters for: Chat interfaces, streaming responses — the user’s perception of “responsiveness.”
TPOT (Time Per Output Token)
Average time between consecutive output tokens during the decode phase:
Also called ITL (Inter-Token Latency). Determines the “typing speed” of the response — 40ms TPOT = ~25 tokens/second ≈ comfortable reading speed.
E2E Latency (End-to-End)
Total time from request to complete response:
Which Metric to Optimize?
| Use case | Input length | Output length | Optimize |
|---|---|---|---|
| Chatbot | Short-medium | Short-medium | TTFT (perceived speed) |
| Code generation | Medium | Long | TPOT (generation speed) |
| Summarization | Long | Short | TTFT (long prefill) |
| Batch processing | Any | Any | Throughput (cost efficiency) |
| Real-time agents | Short | Variable | TTFT + TPOT (both matter) |
2. Throughput Metrics (System Perspective)
| Metric | Definition | Perspective |
|---|---|---|
| Tokens/second (system) | Total output tokens generated per second across all requests | Cluster cost efficiency |
| Tokens/second (per user) | Single user’s output rate ≈ | User experience |
| Requests/second (RPS) | Completed requests per second | Capacity planning |
| Tokens/second/GPU | System throughput / GPU count | Hardware efficiency |
The Throughput-Latency Tradeoff
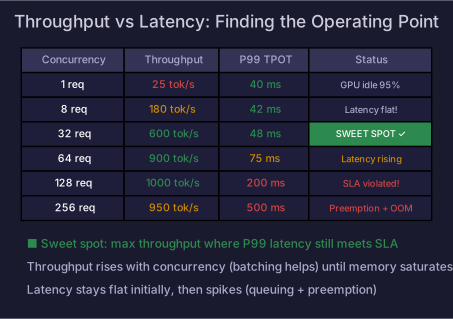
Low concurrency:  Low throughput, low latency (each request gets full GPU)
High concurrency: High throughput, high latency (requests share GPU, queue)
As you increase concurrent requests:
- Throughput rises (better GPU utilization from batching)
- Latency stays flat initially (batch fits in GPU)
- Latency rises when batching saturates (queuing starts)
- Throughput plateaus (GPU fully utilized)
The operating point depends on your SLA: serve at the highest throughput that keeps P99 latency within bounds.
3. Tail Latency (SLA Perspective)
Average latency is misleading. A system with 50ms average TPOT may have P99 TPOT of 200ms — 4× worse for the unlucky 1% of tokens.
Why Tails Are Fat
| Cause | Effect on latency |
|---|---|
| Long prefill blocking decode | Decode tokens delayed while GPU processes a long prompt |
| Preemption (KV cache eviction) | Request paused, KV cache swapped to CPU, then back |
| Garbage collection | Python GC pauses → CUDA stream stalls |
| Network jitter (distributed serving) | TP AllReduce varies |
| Batch composition | One slow request delays the entire batch |
Measuring Tails
# Using GenAI-Perf (NVIDIA)
genai-perf \
  --model llama-3.1-70b \
  --endpoint localhost:8000 \
  --request-rate 10 \
  --warmup 60 \
  --measurement-interval 300

# Key outputs:
# TTFT: avg, P50, P90, P95, P99
# TPOT: avg, P50, P90, P95, P99
# Throughput: tokens/s
4. Goodput: The Real Efficiency Metric
Goodput counts only requests that meet the SLA — requests that complete but exceed the latency target don’t count.
| System | RPS | % meeting SLA (P99 TTFT < 2s) | Goodput |
|---|---|---|---|
| A (conservative batching) | 50 | 99% | 49.5 |
| B (aggressive batching) | 80 | 70% | 56 |
| C (optimized) | 75 | 95% | 71.25 ← best |
System B has highest RPS but worst goodput — it’s pushing too hard and violating SLAs.
5. Benchmarking Best Practices
| Practice | Why |
|---|---|
| Use realistic prompt/output length distributions | Not just fixed 128/128 — use your actual production distribution |
| Measure under load | Single-request latency is meaningless for production |
| Report P50, P90, P99 | Averages hide tail latency problems |
| Warm up before measuring | First requests hit cold caches, JIT compilation |
| Measure throughput at target latency | “Max throughput” without latency constraint is misleading |
| Use standard tools | GenAI-Perf, vLLM benchmark, ShareGPT dataset |
# vLLM built-in benchmark
python -m vllm.entrypoints.openai.api_server --model meta-llama/Llama-3.1-70B

# Benchmark with realistic workload
python benchmark_serving.py \
    --model meta-llama/Llama-3.1-70B \
    --dataset-name sharegpt \
    --request-rate 10 \
    --num-prompts 1000
For understanding how engines achieve low latency, see Prefill & Decode Phases. For how to actually tune an engine for your SLA, see Practical Integration.
Self-Check
- Define TTFT, TPOT, and E2E latency with formulas
- Determine which metric to optimize for a given use case
- Explain the throughput-latency tradeoff and how to find the operating point
- Explain why P99 latency matters more than average for production
- Calculate goodput from RPS and SLA compliance rate
- Set up a benchmark with realistic load and proper warm-up